LES overview
Simulation settings
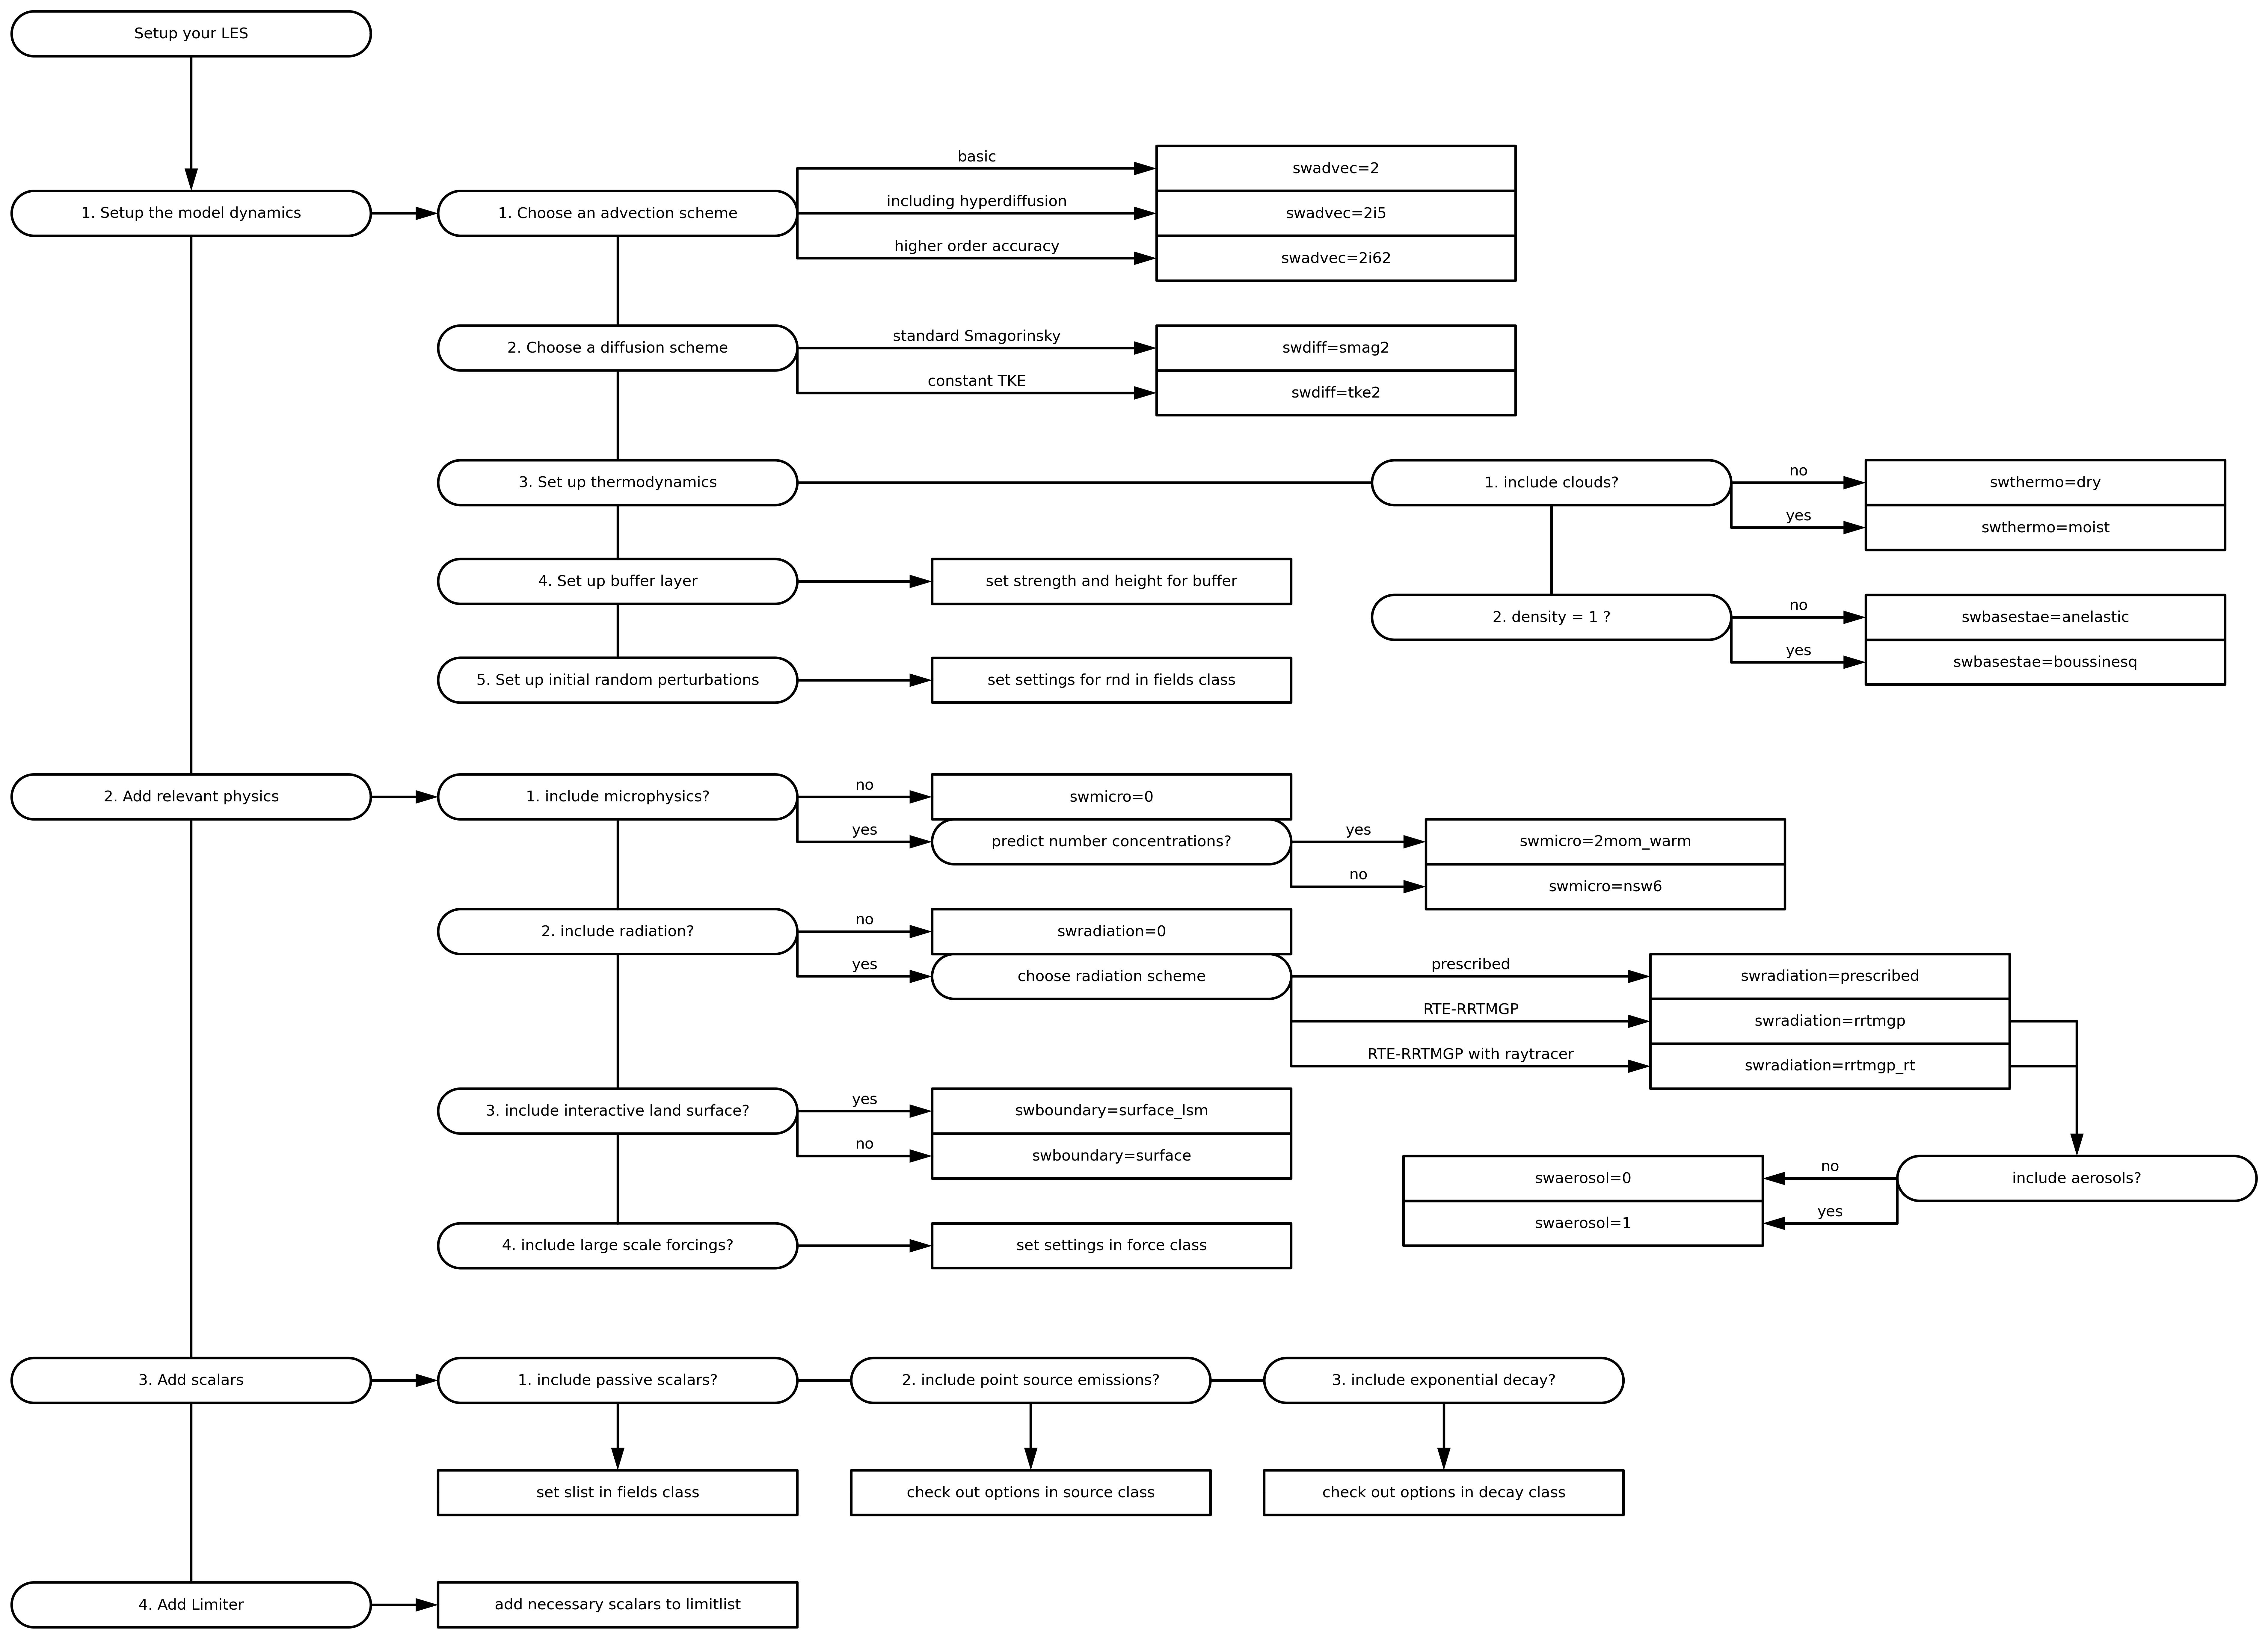
The decision tree below provides an overview of the main available options in the model for LES. Note that many more (detailed) options are available. Therefore, it is advised to check out the complete list of the options in The .ini file for the classes included in your simulation.
For any simulation, the grid and time settings have to be specified (Grid [grid] and Timeloop [time]),
as well as the viscosity (Fields [fields] visc and svisc).
Hence these are not included in the scheme below.
Output
In addition to the aspects in the decision tree there are classes that control the output settings. These are:
domain average statistics: Statistics [stats]
single column output: Column [column]
cross sections: Cross sections [cross]
3D field dumps: Dump of 3D fields [dump]
budgets of the second order moments: Budget statistics [budget]
Example
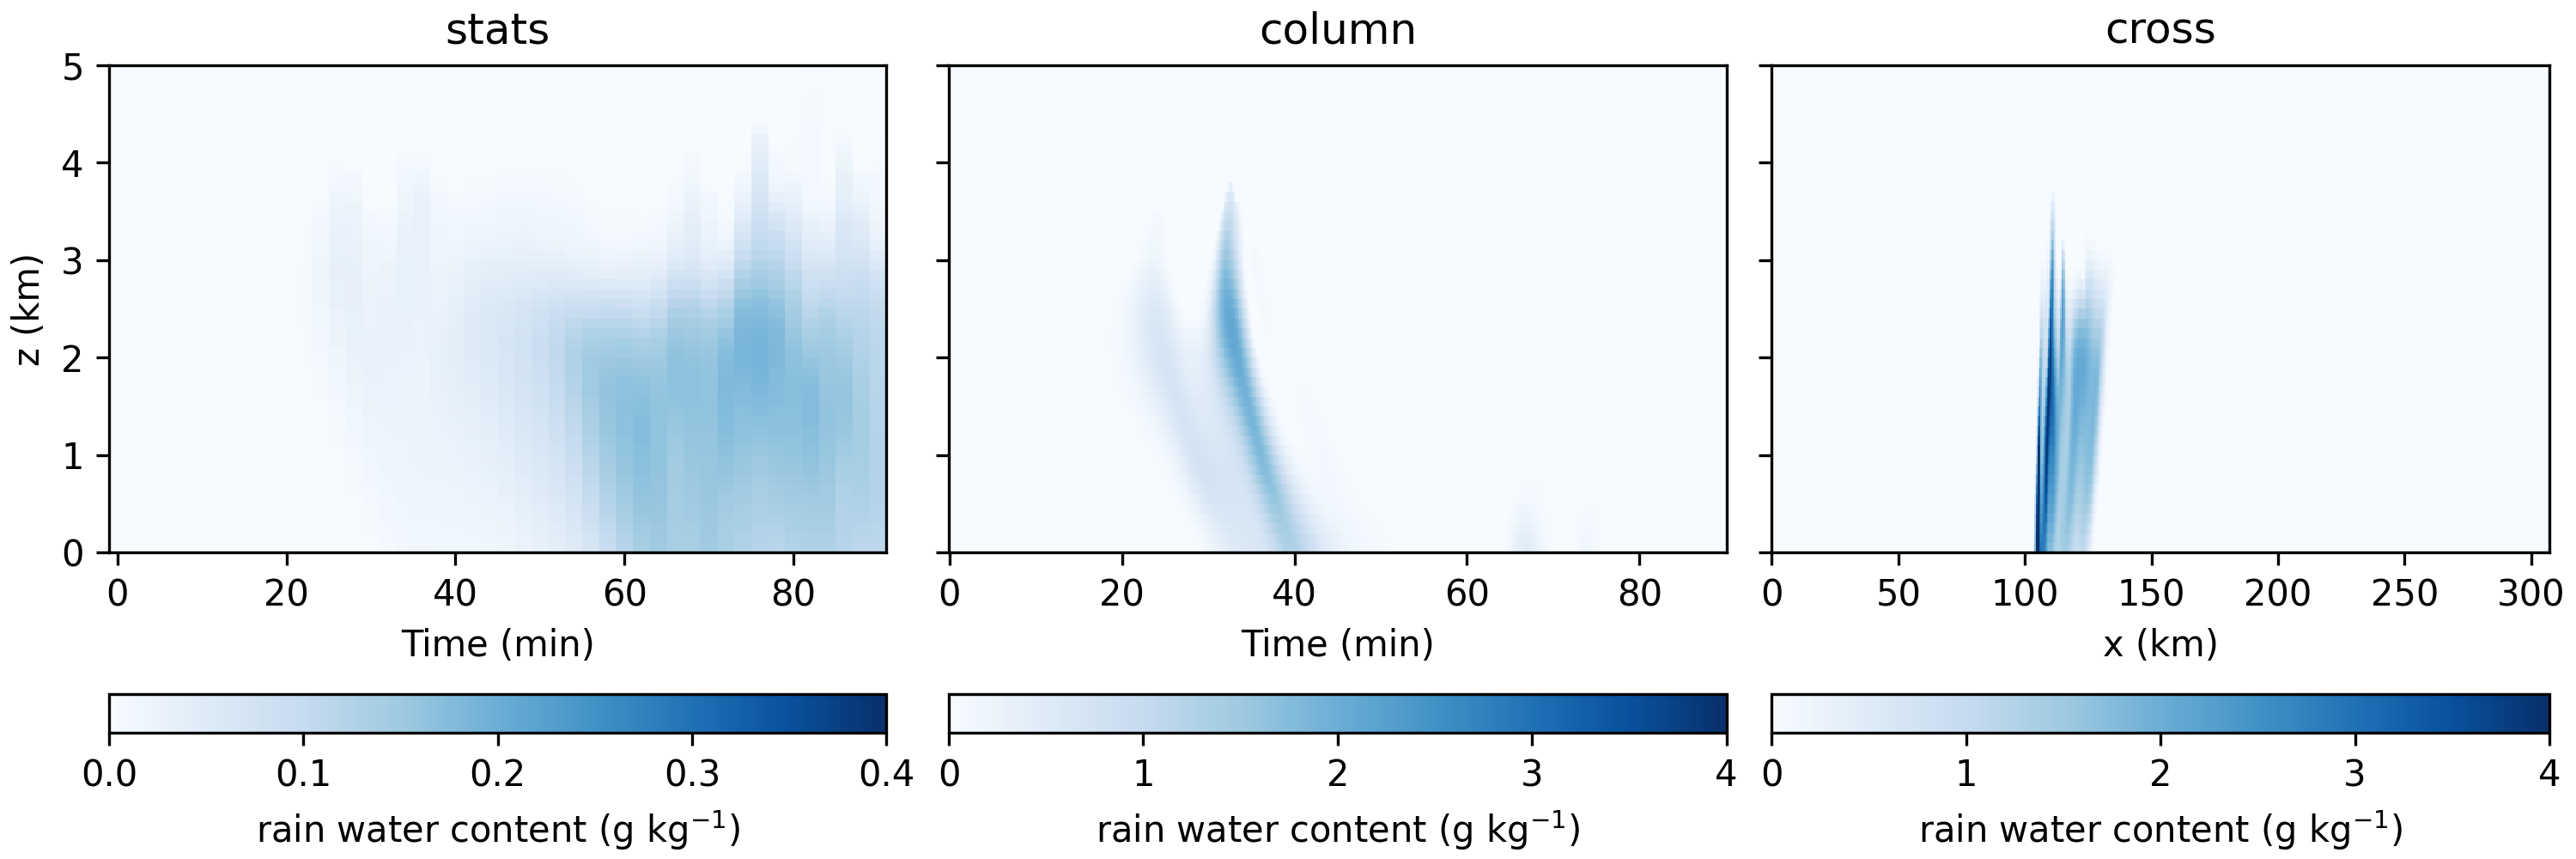
The figure below shows examples of different output types (domain average statistics, single columns, and cross sections). The figure shows rain water content in the the Weisman Klemp case. More examples from this case are shown in Idealized LES: beyond the drycblles. On the left, the domain average values. In the center, the values in a column, which is located at half the y domain size and 1/3 the x domain size. On the right, the values in a xz cross section located at half the y domain size for time = 60 minutes.
Note